
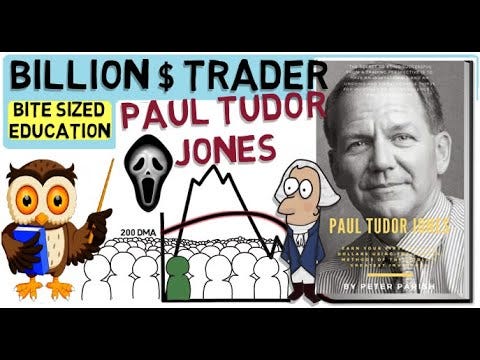

PAUL TUDOR JONES 200-Day Moving Average vs Buy-and-hold.

I watched this video, which explains that the 200-day Moving average is a great way to limit your losses in the stock market. So I decided to test it vs. buy and hold.
The 200-day moving average is a widely recognized trading tool at the core of many successful trading strategies, including those of legendary billionaire stock trader Paul Tudor Jones. This article aims to shed light on this essential metric vs. buy-and-hold.
What is the 200-Day Moving Average?
The 200-day moving average (200-DMA) is a trend-following indicator that calculates the average closing price of a particular asset, such as a stock or commodity, over the past 200 days. By plotting this average on a chart, traders can smooth out short-term price fluctuations and gain a clearer picture of the asset's long-term trend.

Paul Tudor Jones's use of the 200-day moving average (200-DMA) to avoid the devastating effects of Black Monday, the stock market crash in 1987, is an example of astute market analysis and timely decision-making. And how he used it as a stop loss and trend reversal.
*200-DMA = 200-day moving average
Why is it Important?
Identifying Trends: The 200-DMA helps traders identify the market's overall direction. If the current price is above the 200-DMA, it often signals an upward trend, and vice versa.
Finding Turning Points: Paul Tudor Jones demonstrated that the 200-DMA can identify market turning points. Crossing the 200-DMA might indicate a confirmed turning point, signaling a buying or selling opportunity.
Risk Management: The 200-DMA can act as a support or resistance level, providing critical insights for setting stop-loss orders and managing risk. Jones himself used this moving average to minimize drawdowns during market crashes.
Reduces Noise: By averaging out short-term price movements, the 200-DMA reduces market noise, offering a more transparent view of the asset's true direction.
How to Use the 200-Day Moving Average
Trend Confirmation: Use the 200-DMA to confirm the direction of the trend. If the price stays consistently above or below the 200-DMA, it can confirm a bullish or bearish trend, respectively.
Entry and Exit Points: Look for crossovers of the 200-DMA as potential entry or exit points. For example, a price exceeding the 200-DMA might signal a buying opportunity.
Risk Control: Implement the 200-DMA as a guideline for stop-loss orders. By placing stop-loss orders near this level, traders can control their risk and protect their capital.
Combination with Other Indicators: The 200-DMA can be combined with other technical indicators to create a more robust trading system. For example, adding momentum or volume indicators may enhance the effectiveness of the 200-DMA signals.
Does it work?
I created a code you can use to back-test stocks yourself.
https://www.tradingview.com/script/gRCJUsMN-Paul-Tudor-Joness-EMA-200-Cross-Strategy/
https://github.com/Neyt/Paul-Tudor-Jones-200-EMA-strategy/blob/main/README.md
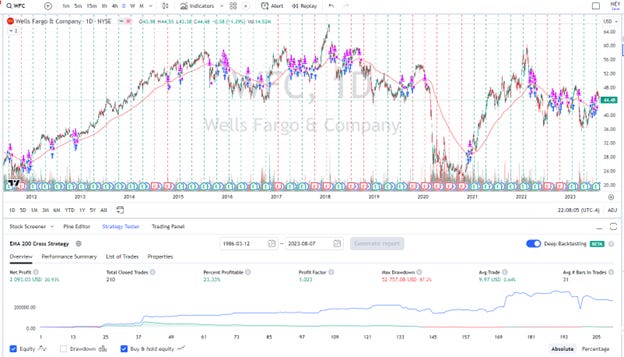
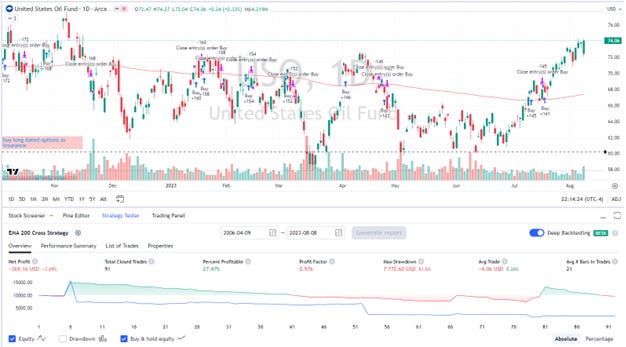
In the charts below, you’ll see random stocks I picked that are part of hundreds of stocks on my watch list. I consider 16 a good-sized sample.
You will see under each chart something like this:

The blue line is buy and hold, and the red line is the equity curve if you used the 200 EMA mechanically as an entry and exit indicator. You can also see the backtest dates at the top of the graph.
Here are some examples:
SP500.
Buy and hold won overwhelmingly.

CCOLA
Buy and hold again!

MSFT
Buy-and-hold wins by a long shot!

WFC
1968 to today; just in case, I also tested 10 years, 20 years, and 30 years. Buy-and-hold wins every time.
BRK.
Buy and hold won!

STNG
200-EMA worked better than buy and hold!

Meta. Buy and hold won!

AMZN. Buy and hold won!

NFLX. They tied!

GOOG. Buy and hold won.

Aapl. Buy and hold.

Uso. Moving Average won.
Xop. Moving Averagewon!

NG
Buy and hold won. Even though Natural gas is known as the “widow maker” because of its volatile nature.

GOLD. Buy and hold again.

Conclusion
Like all trading tools, the 200-DMA is not foolproof. It should be used with other analyses and within the context of a well-rounded trading plan. Embracing the wisdom of experienced traders who have successfully utilized this tool can be an excellent way to enhance your trading acumen.
As you can see, I used it randomly in stocks on my watchlist, including FANG, and the strategy does not beat buy and hold over the long term.
The buy-and-hold method is the best when holding companies that compound with time. Obviously, with bad companies in cyclical markets and much competition with no pricing power, the 200 EMA was better.