The Ney Matrix
How I modified “Kelly’s formula” to calculate how much to buy, or sell considering bad news, and quantify my beliefs of success and potential of an investment.

My promise to you
If you take the next 10 minutes to read this article, I expect you will:
React better under the pressure of falling prices.
Calculate in seconds your position size.
Become more rational about reacting to new information affecting your portfolio.
If you and your colleagues use it, your communication will be clearer.
You will stop describing investments with words like “better” and “worst.” Instead, you will start describing your beliefs and assumptions of risk-reward and probability of success on each investment idea, even if you hate math!
(If you read Superforcasters, the author spends a whole chapter explaining the problems form ambiguity and miscommunication language creates.)
A normal conversation between investors will turn from “I think it is a great opportunity” to “I think there is an 80% chance for a double in 2 years”.
Realize that if you are not doing so already is because of fear of being judged. With this tool, you can’t be wrong because you describe your beliefs.
Be able to put in a new idea context immediately within your portfolio. Maybe that “great opportunity” should be a 20% position in one investor’s portfolio while it is just a 4% position in yours.
Find if an investment doesn’t cut the threshold immediately with this tool

Access a demo by clicking here
Intro
Not so long ago, I was listening to the audiobook “Superforcasters,” the best seller that describes ordinary people who make forecasts that can be shown by statistical means to be consistently more accurate than the public or experts. Suddenly it hit me like a ton of bricks. What the Superforcasters described in the book do, is exactly what the Matrix I created does in investing. I’m far from being a “super forecaster,” but we are all forecasters in the investment world. I’m about to show you ideas that will change the way you trade or invest.
(I’ll leave the comments open for this one in case you have suggestions or questions. And if you like it don’t forget to share!)
What do investment, trading, and gambling have in common?
Risk management
What is “risk”?
1. Investors would say the risk is the possibility of permanent capital loss or inadequate return on the kind of capital.
2. Wallstreet (media): would describe volatility as risky
3. Trader: how much you can lose per trade.
In the subjective complexity of the financial world, you can only control three things: when to buy, sell, and how much.
This write-up answers the “how much.”
The first person to open my eyes to this was Van Tharp, an original “Market wizard,” who sadly passed last year. He was the first to start modeling the psychology of successful traders by researching thousands of successful traders through NLP (as a neuro-linguistic programming modeler). He found that different people hold different beliefs, but their risk management made them successful.
Van Tharp was the original person to coin the term “positions sizing” he jokes on the podcast episode I made with him that he would have been richer if he had trademarked those words.
Do you have a process to decide when and how much to buy or sell and when to “peel” your positions?
Let me show you how to determine your position size, as you have never seen it before.
Position size
I’ll call this process “how much should I buy” to make it simpler.
We’ll start by reverse-engineering the infamous “Kelly’s formula.” This write-up goes beyond Kelly’s formula, so if you already know about it, love it or hate it, make sure not to stop reading.
Quickly, what’s Kelly’s formula?
The Kelly Criterion is a mathematical formula that helps investors and gamblers calculate what percentage of their money they should allocate to each investment or bet.
Created by John Kelly, a researcher at Bell Labs, who originally developed the formula to analyze long-distance telephone signal noise.
Represents the size of a position an investor should take, thereby helping with portfolio diversification and money management. https://www.investopedia.com/articles/trading/04/091504.asp
Introducing R multiples!
“R” stands for risk. How much are you willing to lose?
R multiple comes from dividing your potential loss by potential profit.
Here is a real-live example:
Imagine you think $MRMD will go back to prior highs.
A value investor may say, “I’ll buy no matter the price until the story changes, no matter how much the price falls.” In that case, we can conservatively assume that the position risk is 100% and it has 100% upside. (Also written as 1:1 ratio)
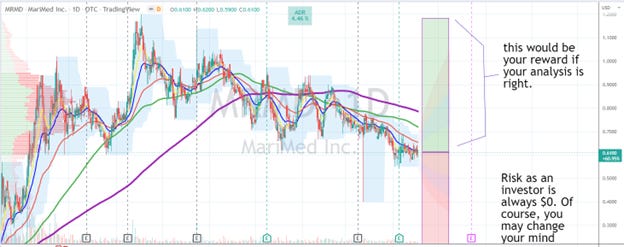
In the case of a trader your risk is more limited, you may say “if it goes lower than this, I’m out” your risk may be around 10% like here:

We can see that the trader has a 9 to 1 risk multiple (also called “R”).
Who is in a better position? The trader or the long-term investor?
Good question! We don’t know yet.
The higher your “Risk reward ratio,” the less likely it is to become true.
Why?
Because the trader only needs a 10% drop in price to take him out of the game. At the same time, the investor can sit there and wait.
Kelly formula forces you to make an educated guess of:
1. Probability of winning
2. Probability of losing
3. How much do I expect to win?
4. How much am I willing to lose?

Here is “A-Ha” moment number one: You already have those numbers subconsciously; that’s why you chose to pay or not to pay attention to a trade. Now, it turns into a matter of taking those subconscious beliefs and writing them down to be able to question them daily.
The goal of this exercise is to adjust the odds the more research you do, and the more information you gather.
I can already hear people arguing “but is impossible to know the odds”. Of course, is impossible, but this is about assessing your biases, and beliefs.
Problems!
At the end of this writeup, in the note section, I added the issues with using this approach. The formula was developed for gambling, in events where you know the odds of something, where you can play multiple times, and it doesn’t take time or cost of money into account!
Cost-conscious Kelly Formula (c.c.k)
The first thing I needed to do with the “Kelly formula” was figure out how to make it account for our cost of capital.
To solve this, we need to adjust the original formula. I call this the “Cost-conscious Kelly Formula.”
The way I did this was to add the typical compound interest formula to the Kelly formula. (If you need a refresher on the compound interest rate formula, I added it at the end as notes.)
The cost of capital diminishes the R multiple; this would punish any possible investment or trade that didn’t have enough potential to cover the cost of capital.

C.C.K% = PROBABILITY OF WINNING-((1-PROBABILITY OF WINNING)/ (RISK MULTIPLE-(((1+Cost of capital per year) ^years)-1)))
Note: when you get negative numbers, it doesn’t mean you have to short the stock, it means that it didn’t make it through our threshold cost of capital.
If you get 4.03%, it means that in theory, you should invest a maximum of that percentage of your account, to optimize your returns.
Note: if you put this on a spreadsheet, you can see if this is an idea that would fit into your portfolio objectively based on your current beliefs. There have been times when I updated my beliefs gradually and slowly after new information just to realize that the investment, I’m holding is not worth holding anymore. I wouldn’t be able to do those distinctions without this tool, because humans get used to old bad news. My question to you would be, do you have a way to punish a stock or business every time it shows bad news? You probably should, at least gradually. Or do you just wait until one day you are “tired of holding it?”
The “Ney position size”
How do I apply this to a portfolio of stocks or investments?
Let’s imagine you have 9 stocks in your portfolio and cash (as a 10th position).
1) Calculate the c.c.k for each investment.
2) Add all the Kelly’s (we ignore cash for now) and then do a pondered average:
63.24%
63.56%
25.02%
41.95%
8.38%
44.50%
12.29%
39.98%
25.18%
3) You add them up to 324.09% and now you divide each one by the total:
19.5%
19.6%
7.7%
12.9%
2.6%
13.7%
3.8%
12.3%
7.8%
This should add up to 100%.
4) Use the cash as a percentage of the portfolio to shrink this number.
Let’s say you want 10% of cash in your portfolio. This is how it will affect the first position
Ney position size = 19.5% * (1 - 10%) = 17.56%
You end up with something like this
17.56%
17.65%
6.95%
5.82%
2.33%
6.18%
3.41%
11.10%
6.99%
Plus 10% in cash.
Now let’s take theory to practice:
Ney Matrix:

Everything in Yellow is where your input is needed. When I get new information about a stock that I already own, I just come here and update the “probability of winning” and “exit price”. The rest is done automatically.
I can’t stress how important is to have something like this in writing. Every time their bad news for example it should be reflected in your beliefs about the stock immediately. Most people take small bad news one after another, until one day they explode! You can see it on tweeter every day. Also, this stops you from being a “permabull” which is probably riskier than being a pessimist.
First: the lower part is a replica of the upper part and holds stocks that are being considered.

We start by inputting our cost of money and minimum cash desired in the portfolio.


Column B is where the names of the stocks go (I covered them for now). As you can see, I have 19 spots and cash. But we only have six stocks currently.
Column C is the actual position size in your portfolio.
Column D is the current “Ney position size” on the portfolio; this is calculated automatically later.

Column E shows the implied winning probability by my real “portfolio position size.” (Column C).
This is very useful because it reverses engineers’ probability of winning based on their position size. In this case, you can see that position 1 with a real 20% portfolio position size (column C) shows a 55.87% winning probability (column E). It reads “based on my 20% position on stock ___ I believe that there is a 55.87% chance of the stock getting to ___ in ___”.
This allows me to see the problem differently. For example, when I hear bad news about the stock. The first thing I think about is how my perception of the odds is affected, then I look at this and see how my portfolio is expressing this.
It looks like this:
News:
- “oh no, the company has problems!”
Me, after thinking about it the news:
- “How does this affect my valuation (an exit price), my odds of making it there, and the time to get there?”
- “I think it affects the odds in 5%, but the risk-reward (company valuation) shouldn’t be affected, and the investment timeframe will be six months longer.”
Then I plug those numbers into the columns below.
- “ok, the matrix is telling me to cut my position by 1.84%.”
Wasn’t that easier?

Columns “G” to “I.” Pull’s information automatically of the stock, market cap, share in millions, and price today.
J is my first input “exit price”, “fair value” I put a price that I would get out today, this is a moving target, and this is what you focus on.
K divides the “price today” and the “exit price” to obtain the risk multiple since I always assume a total loss as a worst-case scenario to be conservative.
L asks for the “probability of winning”; this is what we focus on.
M is the number of years you expect would be needed.

N is a compound interest formula to calculate the cost of capital through the investment life (formula in the notes section).
O, how much would the investment do annually if successful?
P, cost-conscious Kelly (I just used it as a base for future calculations).
Columns Q to X, are hidden for this explanation. They are the same input variables and results for “optimistic” and “pessimistic” scenarios. You can do as many scenarios as you want.

We take column P and “normalized” them by adding them up and dividing each by the total to get the results of Z.
AA is a weight between 0 and 1 that I give to stock in the same industry. 2 stocks get 50% weight each, 4 in the same industry would get 25% each, etc.
AB we get by multiplying AA by Z.
AC is finally the “Ney position size.” Here we consider how much cash you want (from C28)

AD shows the difference between a “cost-conscious Kelly” vs “Ney position size.”
AE, says “TQN” for Traders Quality number (you can google that), but you don’t need it for now.
AF is beta (not necessary)
AG is my initial “gut feeling position” where I write my initial gut feeling when I decide to get the stock, and I keep it there to have a feedback loop. That would have probably been the position I would have taken if I didn’t have this, Matrix.
AH is the valuation model I’m using as a reminder.
The final column is a “why,” here, I write in 1 phrase or two, “I’m buying stock XX because ___.”
Conclusion
When I talk about this subject, normally, I get feedback criticizing how useful the Kelly formula or the Matrix is in real life. That is to miss the point completely. The formula is not wrong; the inputs you assign to it are. When you realize that, you allow yourself to become a better investor by being more granular and precise with your thinking about the variables you assign to your investment idea:
· Time it will take
· Cost of money
· Other opportunities
· How it fits in your portfolio
· Odd of winning
· Upside vs downside
As I promised to you, now you can:
· React better under the pressure of falling prices.
· Calculate in seconds your position size.
· Become more rational about reacting to new information that may affect your portfolio.
· Stop describing investments with words like “better” and “worst”
· Go from “I think it is a great opportunity” to “I think there is an 80% chance for a double in 2 years”.
· With this tool, you can’t be wrong because you describe your perspective.
· Be able to put in a new idea context immediately within your portfolio.
· Find if an investment doesn’t cut the threshold immediately with this tool.
· React better under the pressure of falling prices.
Don’t forget to share!
NeyTorres.com
Notes
Updating constantly is key.
I’ll make a post in the future on how to do it efficiently and some key lessons from Superforcasting.
“The magnitude of his constant course corrections. In almost every case they are small. And that makes a big difference.” - SuperForecasting

A quick tip: What probabilities should I use initially?
I’ll give you a tip I use when I know nothing about stock, and I want to assess probabilities initially, and it only takes seconds to do so. It works well for what Charlie Munger calls “no nothing investors” is an indicator called the “The probability Cone.”

Works based on statistics. Options traders use it all the time to calculate the value of short-term contracts. Of course, it is reliable if you only take a large number of trades through prolonged periods. If you are analyzing the long-term value of a company is not useful but is better than nothing when starting. So use it for short-term “eyeball” or your estimations.
In case you haven’t noticed yet, the probability cone is just a normal distribution turn to its side:

How do you calculate the value of cash on an account?
“Cash should be viewed as a call option without expiration date or strike price, and its value is what it could acquire when used.”
These are big assumptions that are often too theoretical. I won’t even try to tackle it, but if you use the Black Scholes model, you will find that the price of your option is the same as buying the assets themselves. To determine how much money you should have, you need to know: how much you could make with it in the future and when.
The key question becomes: How much can the cash earn if I have it when I need it to buy cheap and other assets versus the upfront cost of holding it?
On the other hand, I would remind you of what our good friend Whitney Tilson posted not so long ago:
“Looking at the 31 years from 1990 through 2020, history tells us that if you missed the five best days in the market, you would have missed out on 37% of the return versus had you just stayed in the whole time. And if you missed out on the top 25 days? It would have been way worse – you would have lost out on 79% of the potential gains.
That’s right... Missing the best 25 out of the approximately 7,800 trading days from 1990 through 2020 would have made you turn $1 into $4.38 when sitting tight would have instead allowed your $1 to grow into $20.45. Missing out on fewer than 1% of the days would have cost you almost 80% of your potential return. No wonder so few people can make money timing the market...”
My conclusion is that you should always try to be fully invested unless you need the cash soon, are trying to time the market, or don’t have enough good investment ideas.
Arguments Against Using the Kelly formula
Monish Pabrai wrote about it in his book but later changed his mind:
“… I’m glad you brought up the Kelly formula the Kelly formula was a mistake on my part. I should have never put it into my book. I should have never talked about it. It works if you are doing 5 000-coin tosses, you know, where “you’re repeatedly making bets with known odds. I mean, if you had heads 51% tails 49%, and someone allowed you to do 5000 coin tosses and you got to pick heads, that would be great to use a Kelly formula to cut your bet size and all of that but in investing, at least the way we practice investing you’re making one-off bets it’s not like 5000 coin tosses so it doesn’t apply and so in hindsight, I realized that if I were to ever do another version of my book or another edition where the odds are low I would acknowledge that, and take that out. So don’t worry about the Kelly formula unless you are in a situation with the ability to make a lot of bets with odds in your favor frequently” - youtube.com/watch?v=bQ9KLjeR3LA

Monish and me, Berkshire Hathaway annual meeting 2022
My response to this start with a question: How many tries do you need to get good results on coin flipping?

https://bookdown.org/gabriel_butler/ECON41Labs/tutorial-2-probability.html
I do think you may need hundreds of tries. But I also think you will likely make them in your investing lifetime.
As for “investing, you’re making one-off bets it’s not like 5000-coin tosses” he is completely right but if you boil down your investment decisions to R multiples is easier to see them as the theoretical “coin tosses” where the variable is pinpointing the accuracy of the probability of success and the risk-reward.
Let me rephrase this last part because it can get complex and is important:
If I understand correctly, he implies something like: “why would you play a “magical” roulette table in the casino if the odds are always changing?”. Does that make sense? Of course, you wouldn’t. I say, “imagine them as multiple roulette tables (with odd in your favor), and you play them with different position sizes given that you know the odds.” Of course, you don’t know the odds on investing, no one does, but that is the job description. When you invest, you already have those odds in your subconscious, like it or not; that’s why you pass or take an investment.
Kelly is not a good formula for investing unless you have multiple tries. If you buy a super investment early in your life and never sell, you are a much better investor than most investor legends. This is what everyone wants but is not realistic.
Look at how many investments or trades you’d done the last couple of years, and now project that to your investment lifetime; it probably would turn out to hundreds, if not more, depending on your age.
Even a younger Buffett did over 300 investments or trades in his partnership years, and we are talking about the role model of “buy and hold.” In real life, investors grow into buying and holding once they have a good amount of money and experience; until then, Kelly is the best we have.
Why not just position the same percentage in all your stocks?
Many say, “I’ll have a portfolio of 20 stocks and put 5% in all of them”.
The only reason I can think to put the same amount in stock are:
· Lazy thinking
· You are just starting and don’t have the experience to create confidence.
· You are trading a statistical system.
Is idea number 20 as good as your best idea? Same time frame? Same risks?
Most people don’t realize that beating an index is hard because it is a TREND-FOLLOWING PONDERED AVERAGE. It means that give more weight to whatever is growing, the best ideas. You should do this to beat the market and put the most money into your best investments.
If you “feel” one stock has too much weight in your portfolio, you can add other stocks that would dilute it, but try not to cut your winners. In that case, you can use the average position size as a guide, and keep adding stocks until the average position size is within your risk profile.

Punish conservative stocks?
This method does punish conservative stocks with limited downside. Imagine two stock
A) can go up 20%, but won’t fall much.
vs
B) can go up 30% but you could lose it all.
Then the formula would punish the safer stock. What you have to do in this case is to manipulate the Risk-Reward ratio to show this.
Paradigm change
This Ney Matrix (I don’t know how to call it) changed my paradigm from thinking “is this a good investment” to “what are my believes about this investment”. The second one is more accurate and realistic.
With this tool, your job in risk management is given by the formula. What you really go to work for every day for is to update your assumption on risk-reward, time, and probability of winning as often as possible.
To learn more about this make sure to read Superforcasters.
When to rebalance
Here is a good short video

Explanation of the compound interest formula
The compound interest formula tells you how much money you would have ended up with (final amount) if you invested an initial amount (principal) at an interest rate (r) and if you would have taken those interests to reinvest again and again for several periods (t).

*We assume n here is 1, meaning they paid interest once a year.
How much would an investment have to make after 4-years to represent 15% annual growth for you?
A = P (1+r/n) ^(n*t)
A = $1(1+0.15/1) ^(1*4)
A = $1*(1.15) ^4
A = $1.74 = 174% of your original investment
The investment you are considering would have to make at least 74% more money than you started four years ago.
Isn’t that the same as saying you need an investment where you can risk 1R to make 1.74R?
In theory, yes, it is! (Ignoring taxes and fees)
Kelly formula, which allows for partial losses:
Optimal F
There is another formula in case you don’t consider the total loss of the investment as the downside.

“The problem with optimal f is that the calculation is dependent on the largest trading loss, and you can never know when that is until it happens... He calculates the level of an efficient frontier for capital commitment and leverage from a system’s historical performance and, as you said, the expected worst loss…[but] you never know the worst possible loss [so this is unrealistic]. - https://www.turtletrader.com/optimal-f/
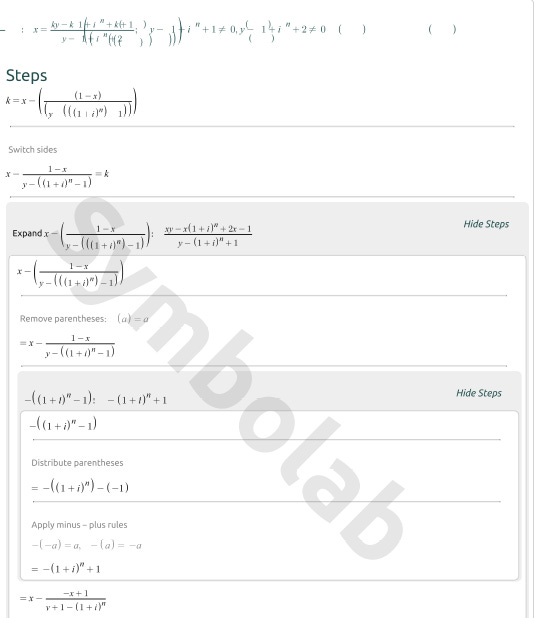
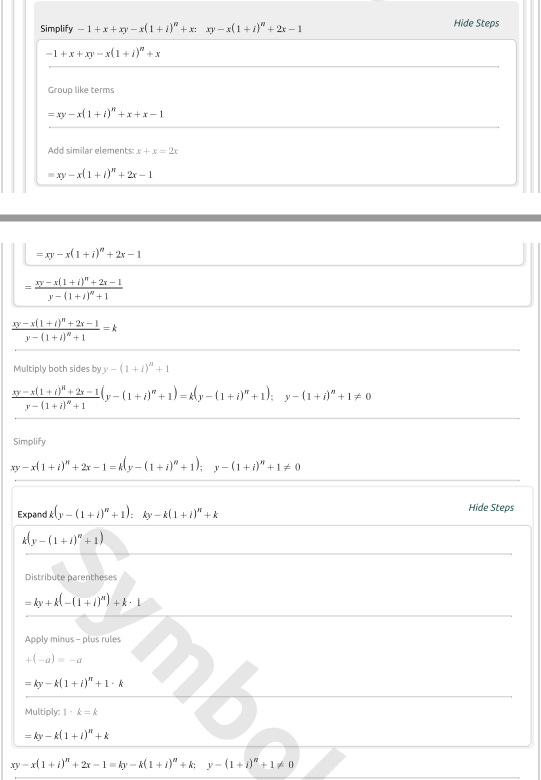
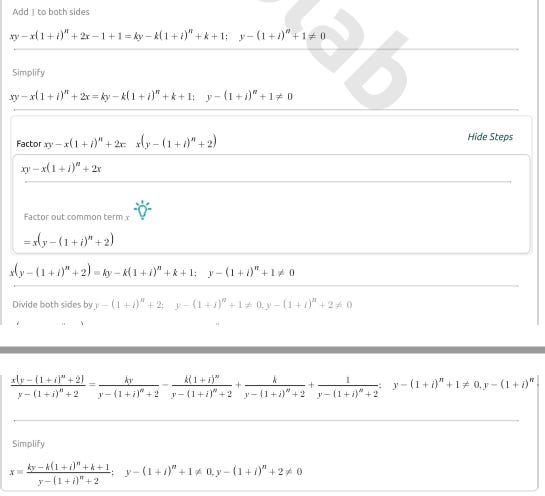
The mathematical formula for cost-conscious Kelly:
(A special thanks to you symbolab. They saved me a day of work, probably)